For those of us who like to watch for when a pot of water starts boiling...
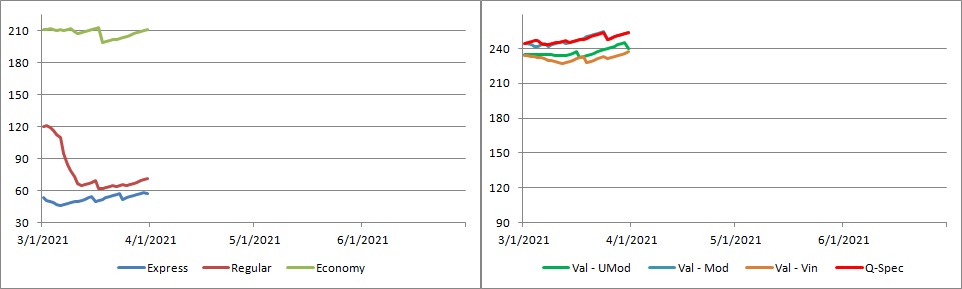
On how to read it, it's the lag in days at the date on x-axis. For example, on 3/1/21 Regular service was complete through about four months prior. That went down to about two months of lag in the middle of March, but has been creeping back up recently.
I'll try to update this graph here about once a month.